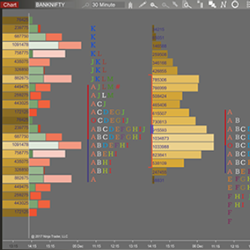
Bell Market Profile aims to help traders visualize what is actually happening in the market by displaying where trades are occurring. It features split vs composite profile, high volume alerts, absolute volume profile all with customizable colors.
Unlock the power of Wyckoff VSA through an optimized package that uses SMART Technology to generate easy-to-use live alerts and preset approaches. Save 80% charting time with SMART Technology. Four easy-to-implement, rules-based strategies. SMART audible notifications for signals and setups.
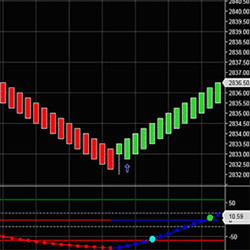
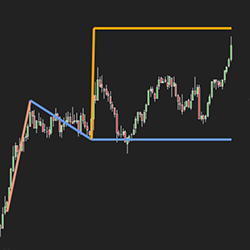
TrendLine Indicator plots red and blue lines to determine the trend. Easily detect the trend direction in any markets so you can easily find ideal trade setups. The red and blue arrows confirm the trend directions and plot above and below the candles.
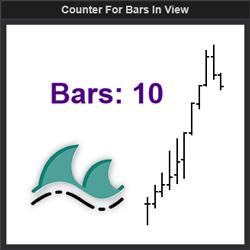
This indicator displays the number of bars in view along with visual reminders if the user is over a defined limit. This increases application functionality and user charting efficiency.
Get precious info to start your trading week! Focused 100% in E-mini S&P500 Futures and based in a mix of technical analysis with order flow tools, the newsletter presents possible trading scenarios for the week, highlighting important regions. Sign up now for FREE!
The Ultimate Pivot Points™ (UPP) Indicator Package is the most advanced and extensive collection of “Pivot Points” Indicators available. It includes every “Pivot Point” method along with several innovative features — making it one of the most complete Support/Resistance indicators on the market!
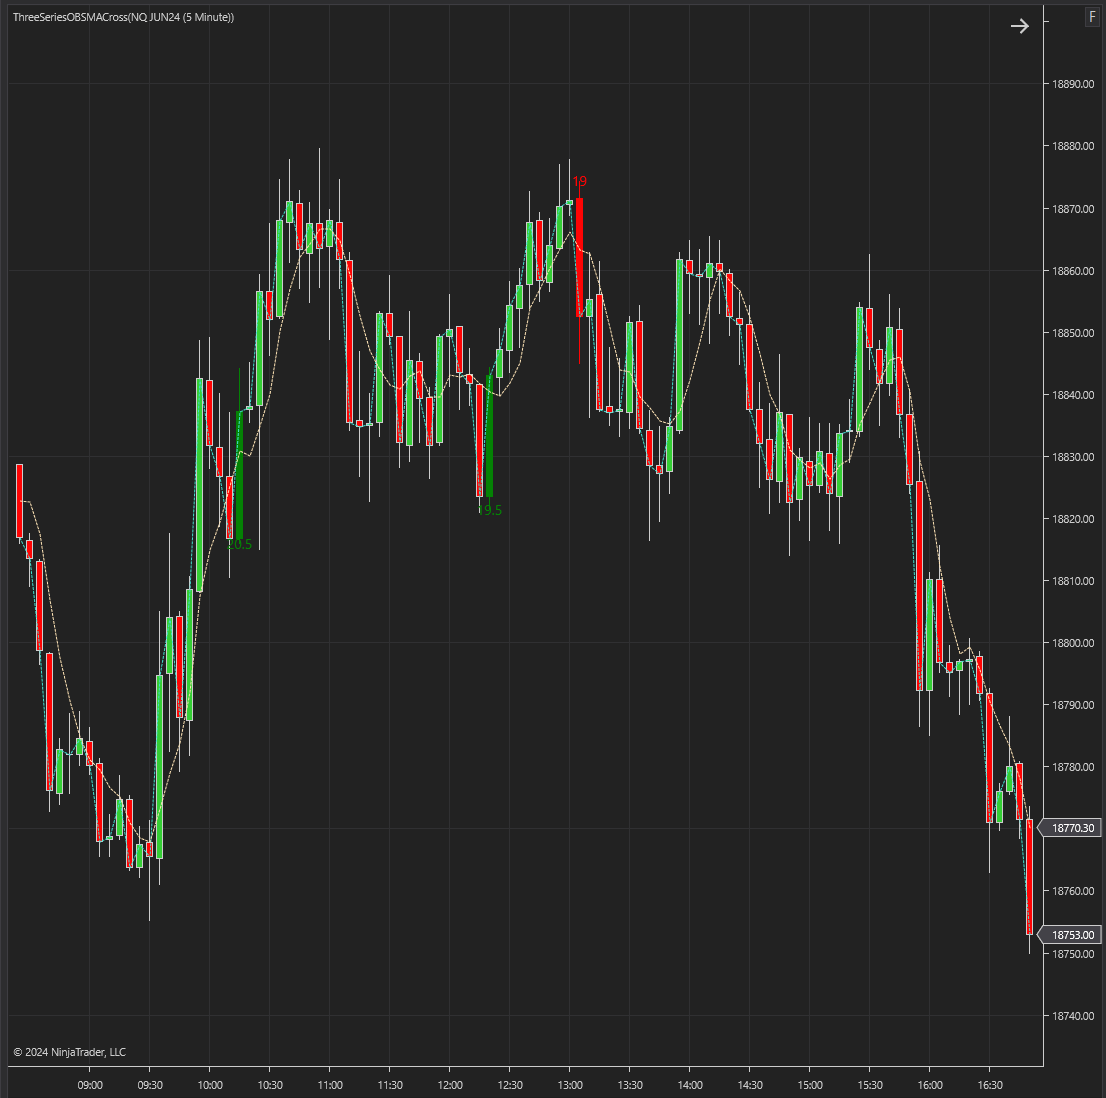
This Indicator is a sophisticated tool designed to help traders identify and capitalize on bullish and bearish market trends. By combining Simple Moving Averages (SMA) and engulfing pattern detection, this indicator provides clear and actionable signals for entering and exiting trades.
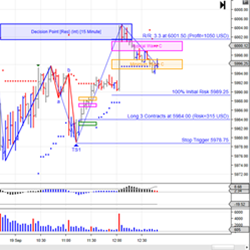
MTPredictor offers a suite of Elliott Wave, Volume, Fibonacci & position sizing add-ons that allow traders to find & asses trades in the Futures, Stocks and Forex Markets. Sign up for a 15-day trial today!
Measured moves are one of the most common trading strategies. However, they can be easy to miss. The Automated Measured Move Indicator from Tyche Trading takes away that difficulty, allowing you to focus on your trading. Never miss a measured move again. Get your seven-day free trial today!
The Trading Room Package is what IndicatorSmart uses in their trading rooms to get the most out of the market (highly recommended). Leases are also available for trading room members.
December 2, 2024
Mastering Sideways Markets With Auction Bars and Range Projections
November 19, 2024
Enhancing Your Automated Trading System: Key Insights from Best Pro Trade
November 14, 2024
NinjaTrader New Ecosystem Tools: October 2024 Edition
Enter Email for Updates