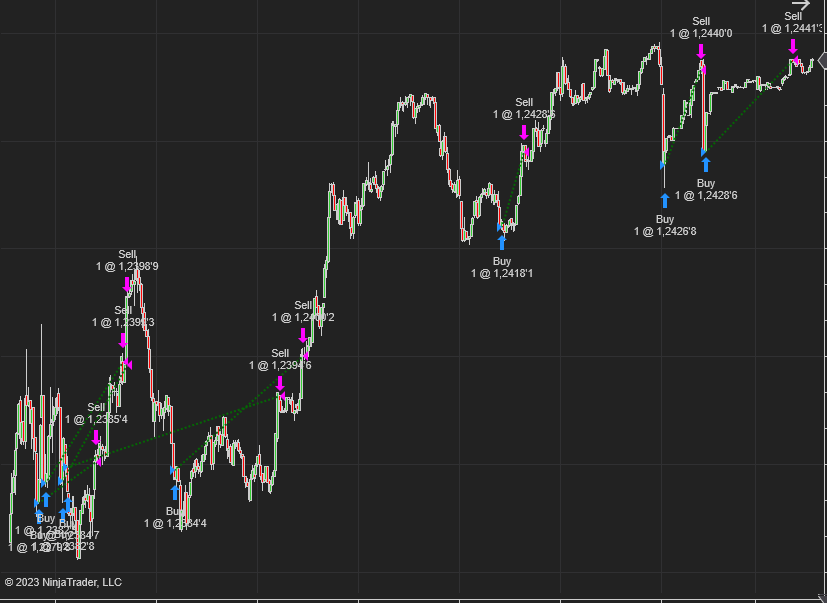
This NinjaTrader strategy identifies major trends, supports/resistances and supply/demand zones and accumulate positions with fractional orders at key price levels and try to resell at profit. The risk management is inbuilt and sophisticated.
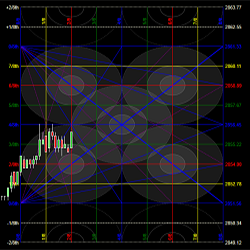
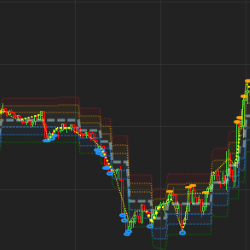
Samri Math RY Intraday is a purely PRICE-based indicator for traders who use Murrey Math methodologies. It works not just with time-based charts (day/minute/second), but also with other chart types such as Renko, Range, Volume and Tick. Multiple algorithms for calculating price levels are included.
These two indicators together will display powerful momentum trading setups by defining the critical levels and pivots. The advantage of this with the market is recognized when repeatable scenarios and situations arise despite the fact that the market never shapes up exactly the same way twice.
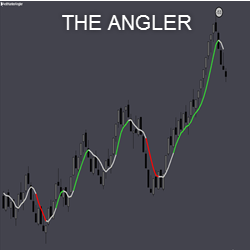
The ability to change colors of a line based on preset angles is revolutionary! Select any up/down trigger angle, any up/down release angle, and receive color changes and alert sounds. Lines stay a triggered color until the release angle is reached. The line then reverts to neutral.
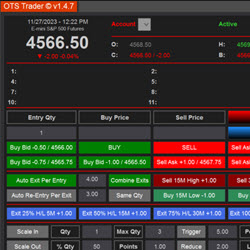
Uniquely streamlines your daily trading tasks, automating processes that would otherwise require manual effort. Organized into four key sections — first entry, second entries, auto stops and auto exits. Plus more.
According to your technical plan, Advanced Software Features will implement a trading idea or an indicator idea using the C# computer code and the NinjaTrader 8 terminal. With the help of additional mathematical libraries, they will be able to develop complex trading algorithms with you.
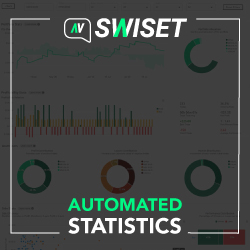
The platform is responsible for finding multiple patterns in operations and provides statistics which help traders in the decision-making process. Try it now free!
See when & where aggressive traders act and track these levels over time with EDGE Zones. emoji trading's order flow analytics track real-time supply & demand. Is it continuing with potential to hold, or exhausting with potential to break? Get started with a free 7-day trial today!
This indicator tracks the Smart Money flow in the market. Following the Smart Money provides a better understanding of the volatility size and trend direction. Ready to see what the Smart Money is doing?
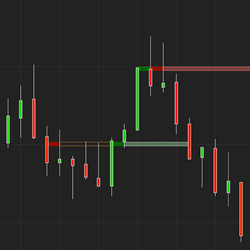
BookMap helps traders detect better support and resistance levels by plotting order book data directly on the chart. Through market depth behind price bars, order flow traders can watch the limit order book unfold in real time, highlighting significant price levels such as support and resistance.
December 2, 2024
Mastering Sideways Markets With Auction Bars and Range Projections
November 19, 2024
Enhancing Your Automated Trading System: Key Insights from Best Pro Trade
November 14, 2024
NinjaTrader New Ecosystem Tools: October 2024 Edition
Enter Email for Updates