The Trend Pullback Reversal (TPR) Indicator displays possible price trends with pullback and reversal signals. TPR will focus on the main trend and filter out most minor price movements. The NinjaTrader 8 version comes with a unique band and center line as additional features.
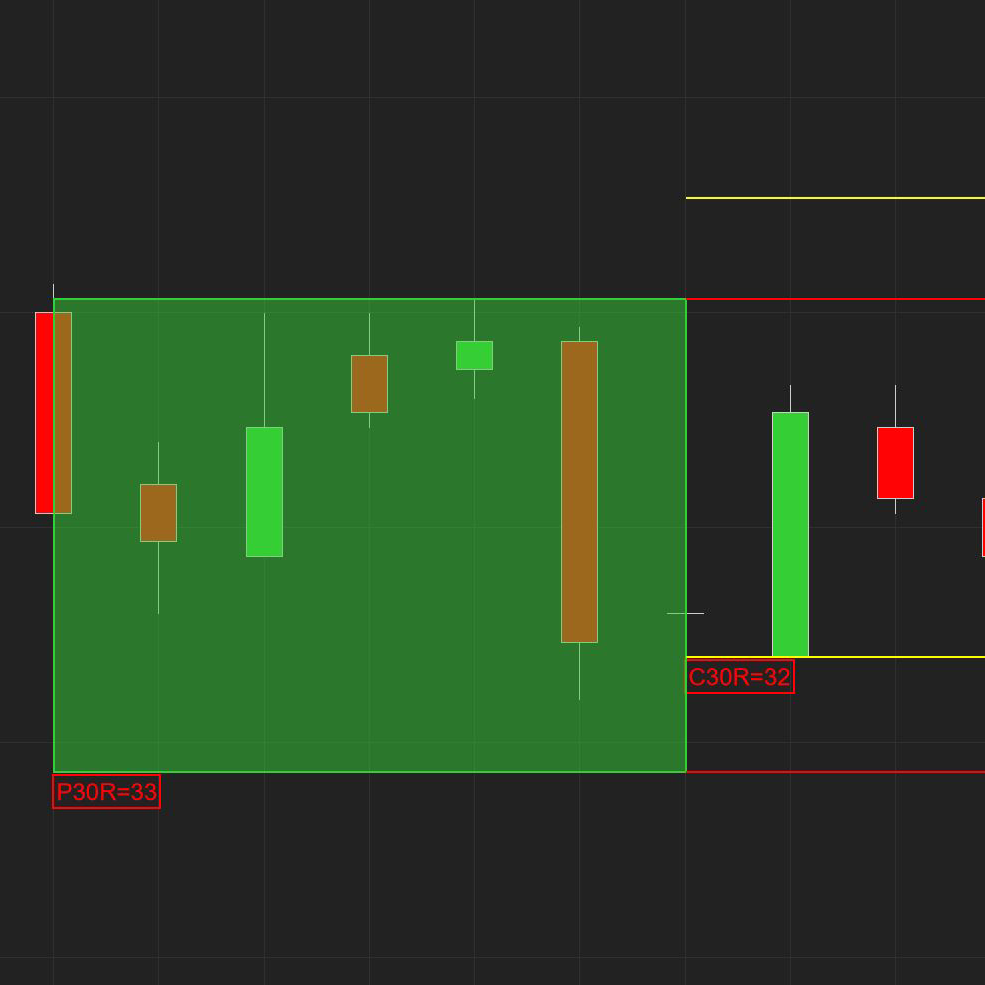
The purpose of the Free 30-Minute Range Indicator is to display visually the Previous 30-Minute Period and the Current 30-Minute Period's relationship to the previous period.
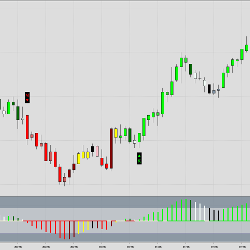
The Zerolag Oscillator is a MACD type momentum oscillator, based on two zerolagging moving averages. The indicator is designed for locating momentum and pullback entries. Momentum entries are found shortly after a trend change, whereas retracement entries focus on the middle chunk of a larger trend.
Learn everything you need to know about charts and technical analysis to become consistent in the markets. This course includes basic structure, support/resistance, trend, supply/demand, Fibonacci, change control zones, divergence, trading psychology, and putting it all together.
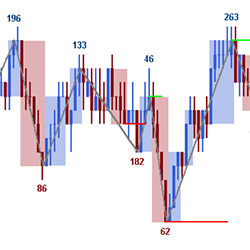
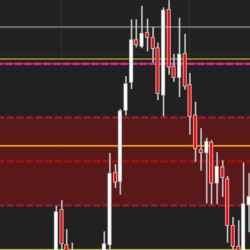
The MAutoFloorCeiling indicator is the culmination of over 2 years of research to determine support / resistance levels automatically. The heart of it utilizes a powerful algorithm based on Wyckoffian concepts of waves, volume, and price levels to gain insight on potential entry points.
The “opening range” is the range obtained from the highest and lowest price of a security during the first minutes of daily trading activity. The JATS Opening Range Indicator displays the OR and the current open of the RTH session for a defined time period, as well as the pre-session Globex.
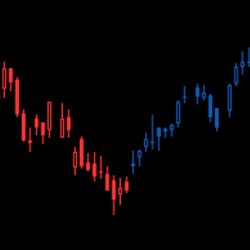
Our trend indicator was designed to offer an easier way to look at candlesticks on a trading chart. It uses a Heiken Ashi formula to improve the visualization of trends & aims to help spot trading opportunities more easily. Its visual approach provides a better picture of the trend. Get it today.
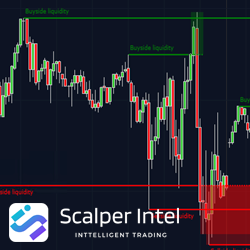
Unlock your trading strategy's potential with the Buyside & Sellside Liquidity Indicator. Gain deep insights into liquidity dynamics in ICT Trading methodology. Key features include Buyside and Sellside liquidity levels, revealing support and resistance zones, and Liquidity Voids.
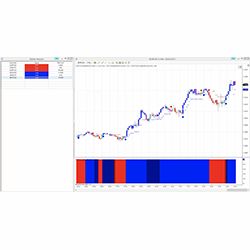
Our Day Trading software is based on price, support & resistance. It has undergone over 1000 hours of machine learning to build its algorithm. We send out algorithm updates regularly to keep the system performing. Built and tuned for day trading, it comes with a market analyzer radar screen.
Trend Support & Resistance works great as a companion to the Trend Ribbon & Buy/Sell indicators. This indicator identifies support & resistance levels plus forecasts highs / lows. Helps you predict upcoming reversals with confidence. Adjust to your style of trading: intra-day, swing or longer.
December 2, 2024
Mastering Sideways Markets With Auction Bars and Range Projections
November 19, 2024
Enhancing Your Automated Trading System: Key Insights from Best Pro Trade
November 14, 2024
NinjaTrader New Ecosystem Tools: October 2024 Edition
Enter Email for Updates