High performance, fully-automated night and day trading for NQ and MNQ. The VX9 wakes up before sunrise and finds the best trading opportunities in the morning twilight. Built from scratch to be a true day trading system, the VX9 offers simplicity and performance.
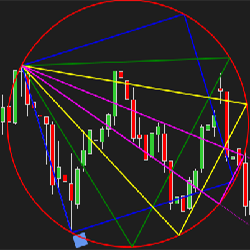
We are pleased to bring NinjaTrader users this tool typically reserved for expensive institutional platforms. The Gann Emblem is a drawing tool for those familiar with its applications, especially traders of the Gartley method.
Performs real-time analysis of the volume and price trends to color the lower panel of the chart with actionable information. When both are trending in the opposite direction, the panel will be colored purple to mark this "unusual behavior." Start using this key Information in your trade plan today!
DataGrabber™ grabs price and volume data for any futures instrument. It is designed to work with the AI prediction software, AITrendPredictor™. DataGrabber™ data files get fed into AITrendPredictor™ to train the AI model to find patterns on price, volume, day and time to make a price prediction.
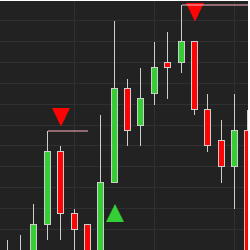
New "Ultimate A.I." indicator has it all: buy and sell signals, trend reversal signals, scalping signals, pullback alerts and stop loss placement lines. It’s multiple systems all in one. Learn more! Watch a demo tutorial by clicking the link! We also have a private chat group. Get a 5 day trial!
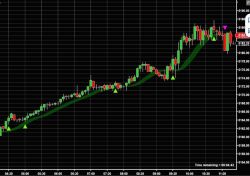
As a companion to our Trend Ribbon indicator, we offer the Trend Buy / Sell Signal. This works with The Trend Ribbon allowing you to select entry and exit points with confidence based on interpretations of the graphics. Fully adjustable to your style of trading: intra-day, swing or longer.
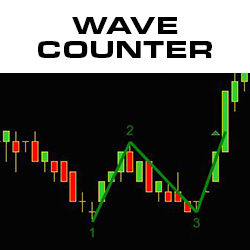
The Wave Counter indicator counts and paints waves in real time, revealing market trends, potential price reversals and no trade zones. The indicator emphasizes wave 3 as the main, informative wave, and creates a "chop box" when there are dueling waves. Download the Wave Counter today.
Neural Director advises trade direction and when to enter with the Golden Signal indicator. This toolset includes a predesigned workspace, accurate daily Power Fibs for many futures and forex markets, automatic Fibonacci extensions and automatic ATM entry.
An ebook that explores my operational strategy in the financial markets, with a focus on technical analysis, operational management and practical techniques. The goal is to gain more awareness and master a style that would otherwise be more complex and require more time.
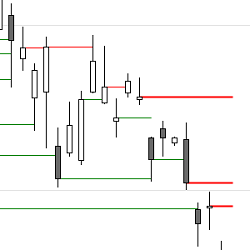
On instruments with regular trading hours you often see gaps on a chart which stay open for more than a day. A couple of times a month these open gaps from prior days also play an obvious role as support or resistance on the intraday chart. These tools are free to download and use!
December 2, 2024
Mastering Sideways Markets With Auction Bars and Range Projections
November 19, 2024
Enhancing Your Automated Trading System: Key Insights from Best Pro Trade
November 14, 2024
NinjaTrader New Ecosystem Tools: October 2024 Edition
Enter Email for Updates