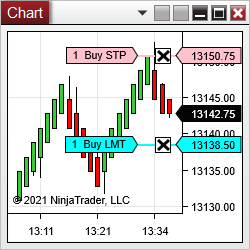
Clicker allows one to enter orders with one click directly on the chart! Modifier keys and mouse buttons for buying and selling are configurable. The order type is detected from the clicked price relative to the market price. All order parameters come from ChartTrader. Free trial for seven days.
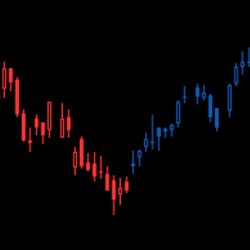
Our trend indicator was designed to offer an easier way to look at candlesticks on a trading chart. It uses a Heiken Ashi formula to improve the visualization of trends & aims to help spot trading opportunities more easily. Its visual approach provides a better picture of the trend. Get it today.
NinjaProgramminSchool has been assisting traders for over 5 years in the creation of custom indicators and automated strategies at a reasonable cost. Do you have an idea you want coded or automated? Let us walk you through the process.
NinjaCoding TPO & VolumeProfile is a multifunctional tool that plots TPO and VolumeProfiles on NinjaTrader charts. Users are presented with single or double views, value area calculations, point of control, color coding, initial balance and much more. Please explore the website for more!
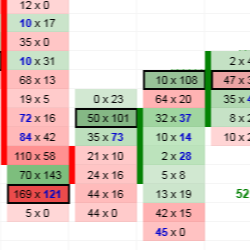
TD Order Flow features Heavy Volume Zones, multiple Volume Nodes, Imbalances, Unfinished Business, a built-in Trades Filter and a separate Cumulative Delta indicator as a bonus. It works with both futures and forex and includes 12 hours of Order Flow video training.
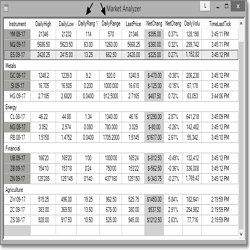
A Market Analyzer column that allows traders to view the daily range of an instrument in points or currency.
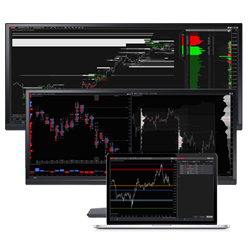
Rancho Dinero's full suite of Acme-brand volume, time, price and order flow analysis tools provide you everything you need to gain deep insight into your markets from multiple perspectives. Study your instruments. Strategize & define your risk. Stalk your trades and when opportunity knocks, strike!
This tool uses price action, trend and momentum to identify price zones (TrapZones) and price bars (TrapBars) where traders can get trapped in the market. Trade good setups while avoiding bad trades e.g. FOMO, catching a falling knife, or fighting the trend, using automated technical analysis!
Side-Bias Indicators include intelligent moving averages and a trailing stop indicator for NinjaTrader. Included are 3 proprietary calculations that track price very accurately yet smoothly, offering stunning support and resistance levels. They pick a side to stick to price while avoiding whipsaws.
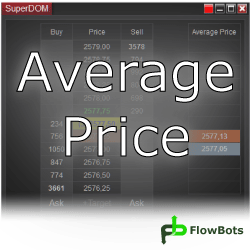
The SuperDOM Average Price Column shows a position average price accumulated since the first order execution. All opened and closed executions from the beginning of the position are used for the calculation. Save time by knowing your current position's average price for all of your past entries!
December 2, 2024
Mastering Sideways Markets With Auction Bars and Range Projections
November 19, 2024
Enhancing Your Automated Trading System: Key Insights from Best Pro Trade
November 14, 2024
NinjaTrader New Ecosystem Tools: October 2024 Edition
Enter Email for Updates