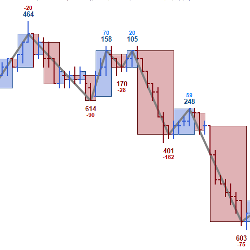
OTM Volume Profile is essential to understand the auction behavior and find key price reaction zones, such as the VPO, high and low value area. This profile preserves and allows to visualize these levels historically, which distinguishes it from static profiles.
MBoxWave Apprenticeship & Training combines their signature Wyckoff Trading System with individualized training and mentorship. Traders’ training is tailored to their trading style and needs based heavily on the Richard Wyckoff Method.
Want to try everything before you buy? Use all of the Fibozachi trading indicators for a full month and take everything for a test drive! You'll have access to over 80 proprietary indicators that cover each and every aspect of trading — volume analysis, candlestick patterns, volatility signals, and more!
The MegaDownloader add-on allows you to download historical data asynchronously in a single window. Load instruments by type and view specifications and all available expiries for each instrument, including rollover period and date/time range for tick, minute, and day-based periods.
ET 8 includes all the features of ET 7 plus the ability to plot trade history. Determine the strength of prior market highs and lows by understanding if they were set from large or small trades to confirm whether large traders are participating in the current market action. Free 2 week trial.
Our MACD Colours is The Prestige Trading Software’s own interpretation of a classic indicator, the MACD. Our version uses a price-reactive color scheme for the elimination of doubt, with everything to the long side turning blue and everything to the short side turning red. Try it for free.
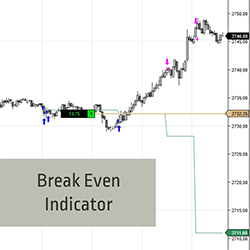
Want to hold on to trades longer? The Break Even indicator calculates profits taken into the average price of the remaining position. See the Break Even line move away from price & gain additional confidence to remain in your trade! It works for both long & short trades. Start your 2-week trial now!
Get information about the development of a dynamic and descretionary trading model. This is intended to inform people of a coaching program tailored to their specific needs in order to make them more consistent traders.
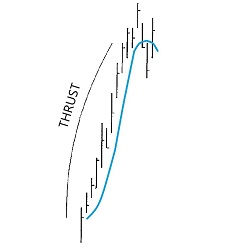
With this tool, traders can now find charts which have potential DiNapoli Directional patterns. Scan multiple markets & time frames in real time for Thrust and other patterns. Use as a chart indicator for easy recognition or as a market analyzer. Video instructions are included - try it today.
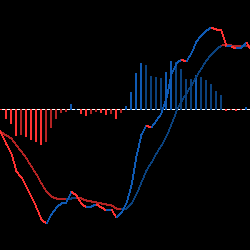
This intelligent indicator will help you predict pullbacks and trend reversals. It uses an innovative form of volatility divergence which helps create consistency. In addition to smart signals and performance statistics, the Divergence Cloud also displays a unique glowing cloud on the chart.
December 2, 2024
Mastering Sideways Markets With Auction Bars and Range Projections
November 19, 2024
Enhancing Your Automated Trading System: Key Insights from Best Pro Trade
November 14, 2024
NinjaTrader New Ecosystem Tools: October 2024 Edition
Enter Email for Updates