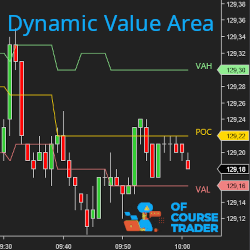
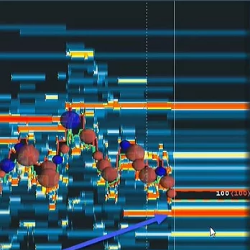
The Dynamic Value Area allows you to visualize in real time the evolution of the POC, VAL, VAH levels corresponding to the most traded value area. It also gives you historical levels. Its NinjaScript API will allow you to integrate the value area into your own indicators and strategies.
Explore the vibrant world of NinjaTrader 8 Add Ons – a treasure trove of powerful tools crafted to elevate your trading game. Dive into an array of clocks, indicators and utilities designed to amplify your market analysis, fine-tune strategies and execute trades with precision.
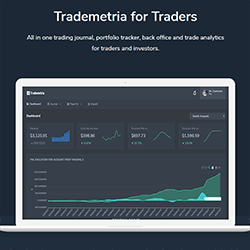
This all-in-one trading journal, portfolio tracker and trade analyzer software helps traders and investors make better trading decisions based on statistical evidence. Better trading starts with better data.
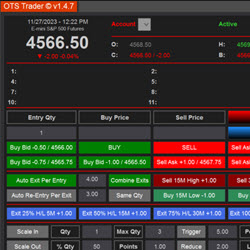
Uniquely streamlines your daily trading tasks, automating processes that would otherwise require manual effort. Organized into four key sections — first entry, second entries, auto stops and auto exits. Plus more.
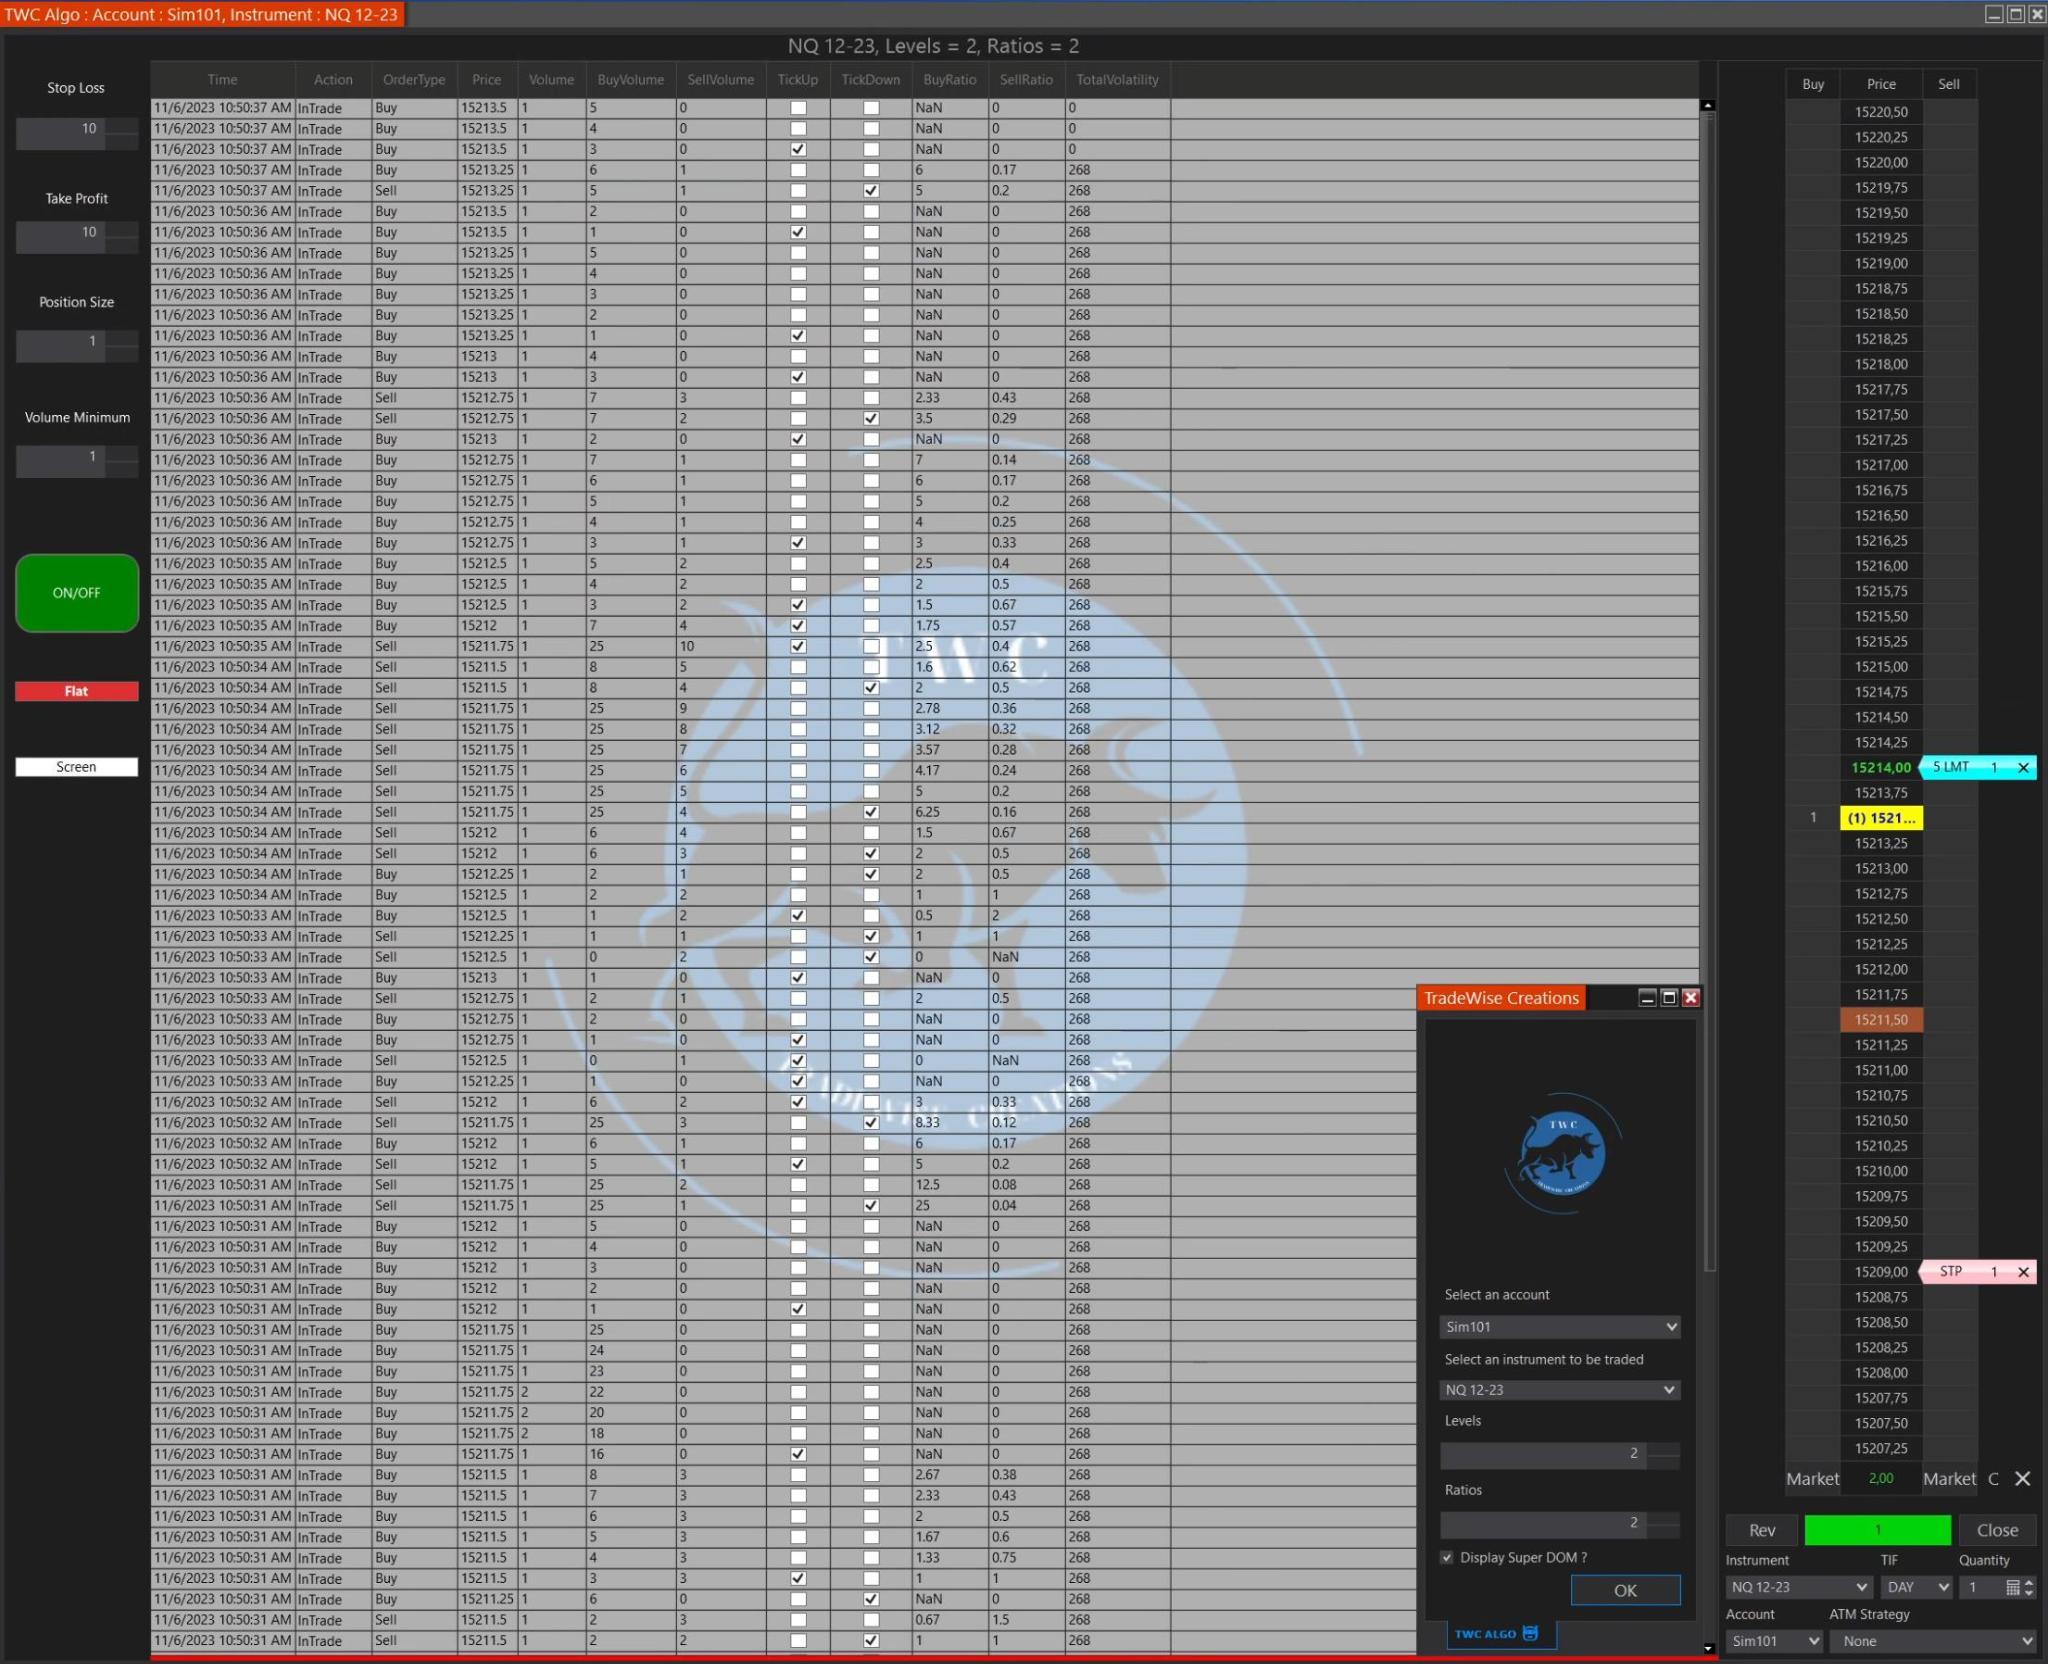
The TWC Semi-Auto Algo is a trading algorithm designed to calculate a ratio between buyers and sellers in the stock market. This type of algorithm is often used by traders to make informed decisions on when to enter the market.
Want to try everything before you buy? Use all of the Fibozachi trading indicators for a full month and take everything for a test drive! You'll have access to over 80 proprietary indicators that cover each and every aspect of trading — volume analysis, candlestick patterns, volatility signals, and more!
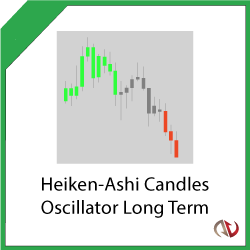
Eliminate noise with this indicator and identify long lasting and actionable trends with zero lag! It accurately visualizes trends and works on any chart type, detecting Bullish, Bearish and Neutral markets.
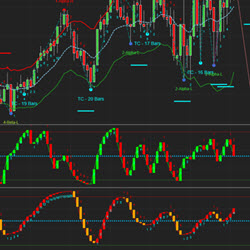
Automatic Cycle Bands, GANN Fan and Fibonacci plotting. Improved double smooth Stochastics, double smooth averages indicators – trend analysis / reversals, 3 volume delta indicators. True average price.
GAP/VWAP Fail is one of Scott's favorite stock setups that can be also applied to futures. A frequent & highly favorable risk-reward play that finds an additional edge by understanding order flow, watch Scott explain it in detail & demonstrate with multiple examples including entry & exit rules.
High performance, fully-automated night and day trading for NQ and MNQ. The VX9 wakes up before sunrise and finds the best trading opportunities in the morning twilight. Built from scratch to be a true day trading system, the VX9 offers simplicity and performance.
December 2, 2024
Mastering Sideways Markets With Auction Bars and Range Projections
November 19, 2024
Enhancing Your Automated Trading System: Key Insights from Best Pro Trade
November 14, 2024
NinjaTrader New Ecosystem Tools: October 2024 Edition
Enter Email for Updates