Side-Bias Indicators include intelligent moving averages and a trailing stop indicator for NinjaTrader. Included are 3 proprietary calculations that track price very accurately yet smoothly, offering stunning support and resistance levels. They pick a side to stick to price while avoiding whipsaws.
An innovative way to analyze trading opportunities. Contextual trading keeps traders on the right side of the market. Qualified supply/demand zones work in sync with institutional traders. Enter trades with the shift of momentum. Learn and trade. Schedule a free consultation with the coach.
For a one-time payment of $300, our beginners forex course is unique for intending and struggling traders to build outstanding skills on forex basics. They'll learn technical, fundamental and sentimental analysis and receive one-on-one mentorship with close monitoring.
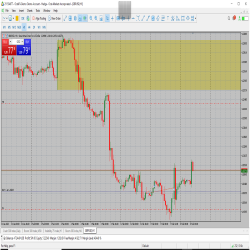
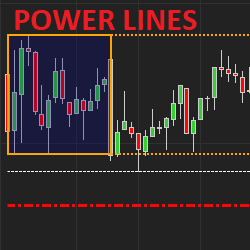
The itcPowerLines indicator displays important intraday support/resistance levels for stock traders (Opening range, morning H/L, yesterday H/L, Weekly H/L, daily SMA/EMA). Colors, styles & width are customizable. Users can also define which elements to display including levels for past days.
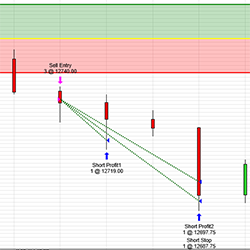
This strategy will trade the opening range and provide targets and stops. It will also trail after each target is hit. The trail and stop levels can be customized as well as the targets.
Sigmalab offers quantitative analysis-based technologies and services to analyze trading logics, operative patterns and trading systems. Learn more!
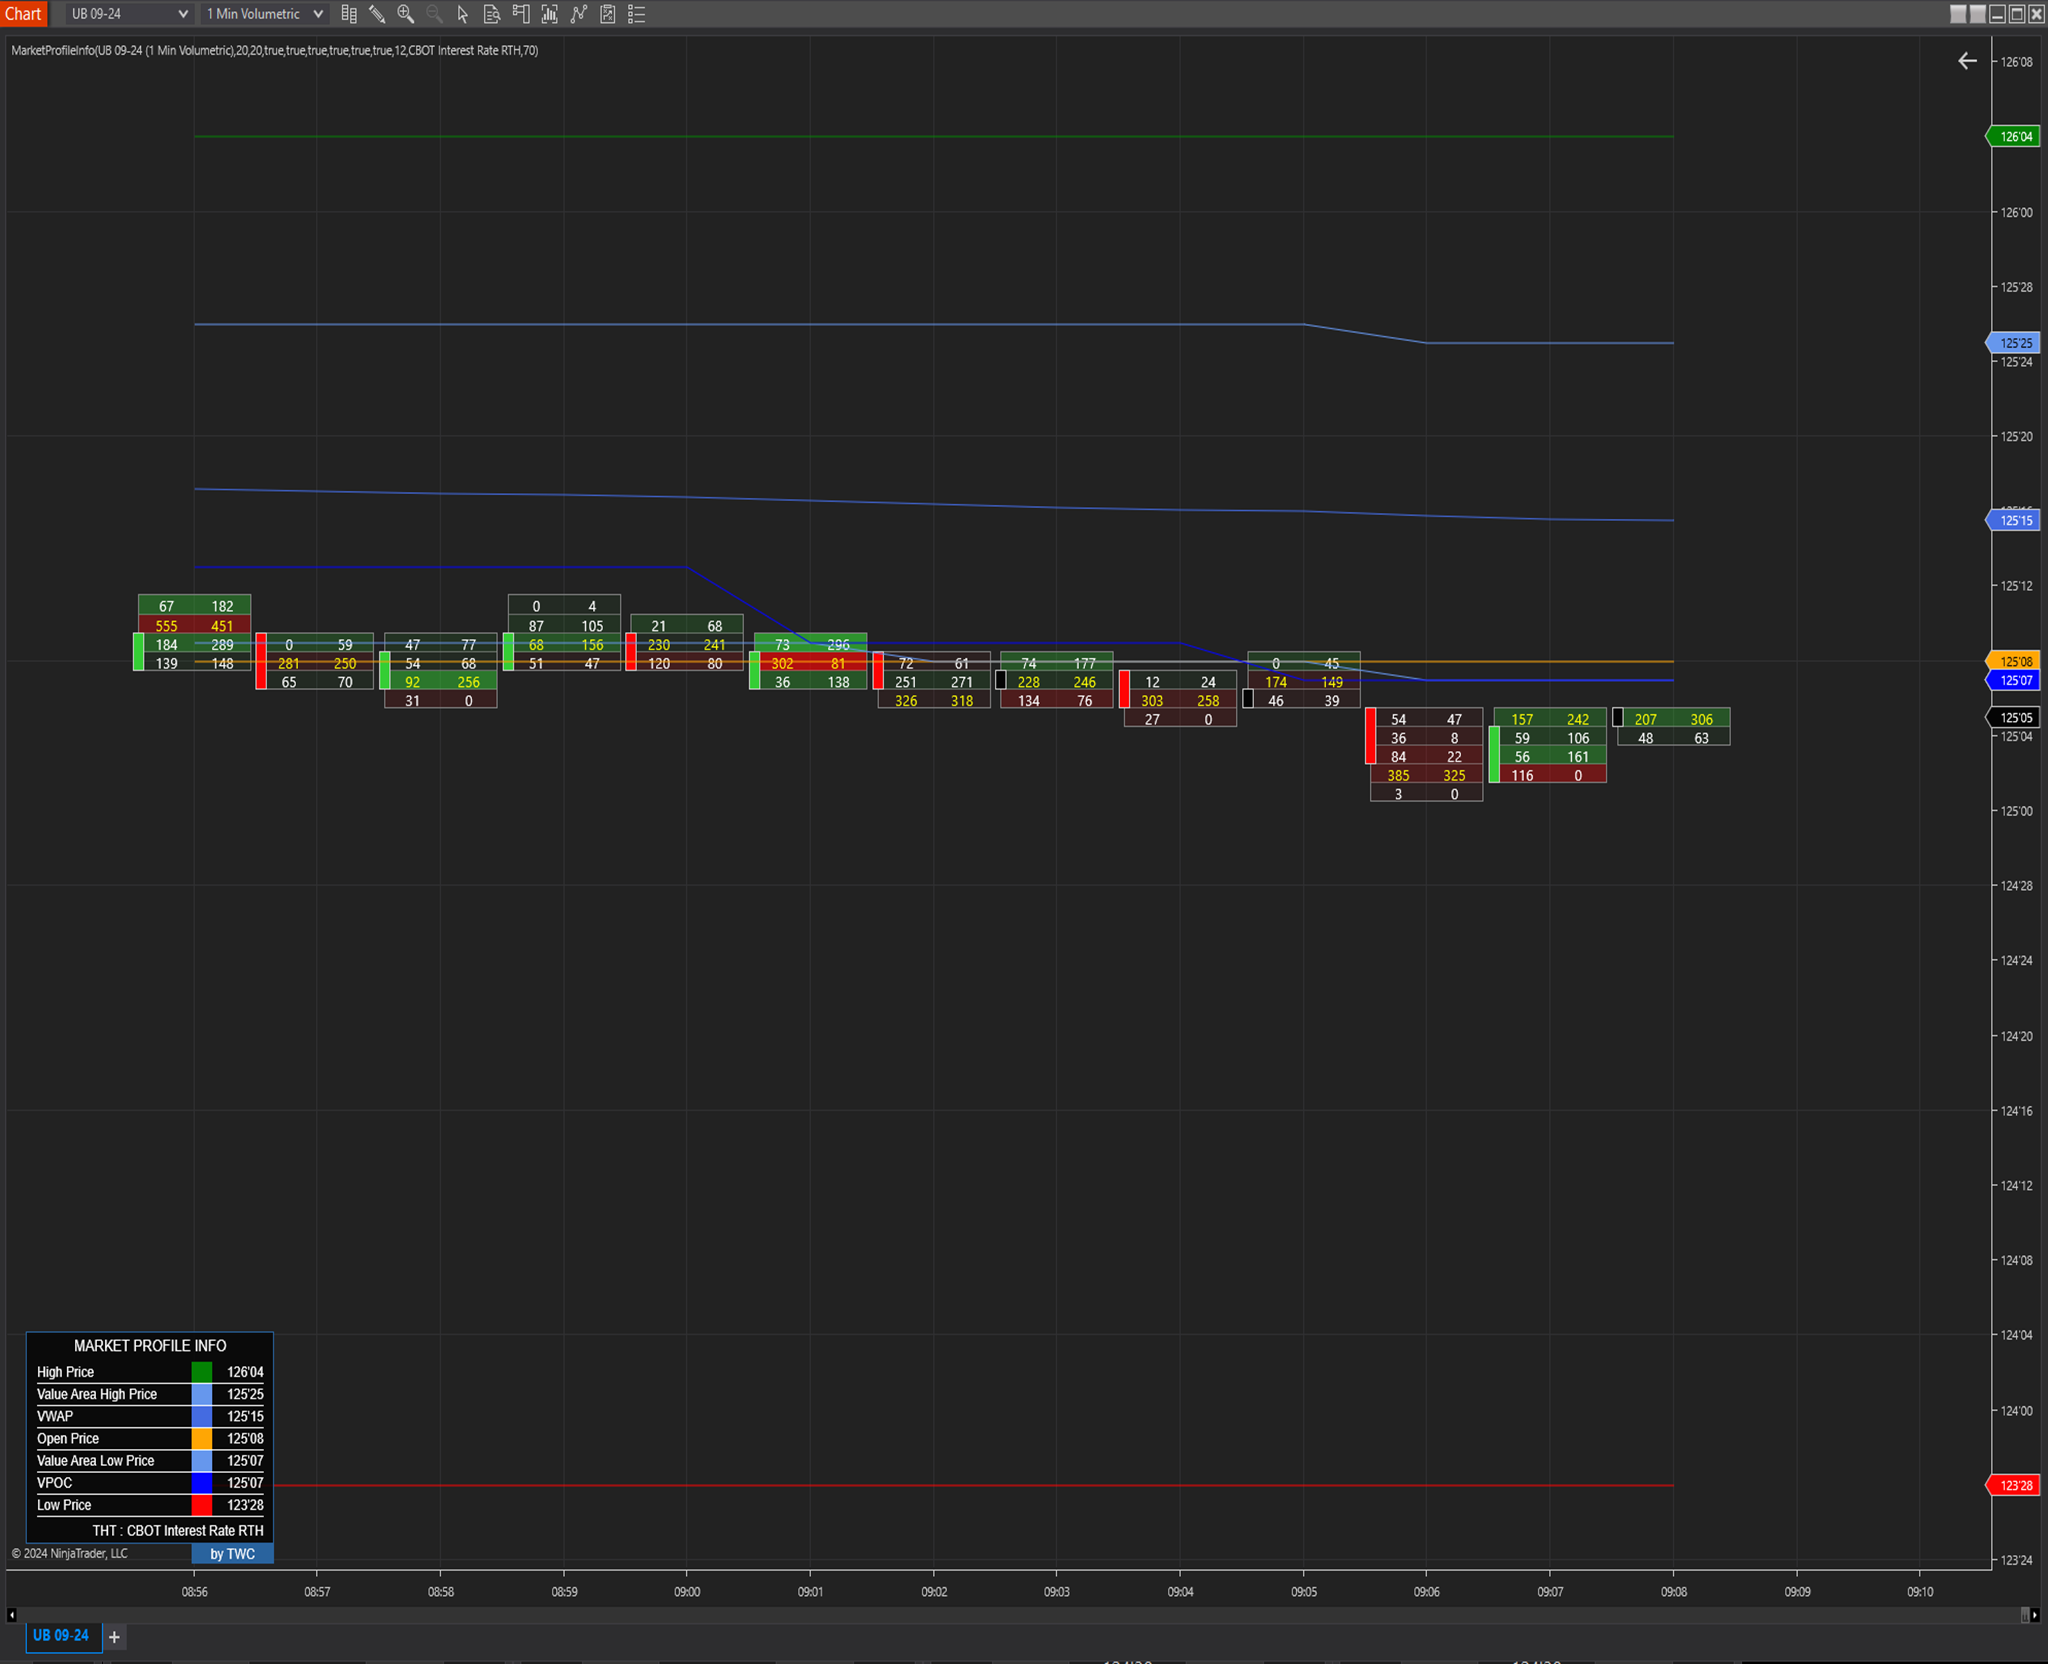
TWC Market Profile Info provides key points on the market profile that are constantly updated in real-time, including the high price of the day, value area high, volume Point of Control (POC), Volume Weighted Average Price (VWAP), value area low, and the low price of the day.
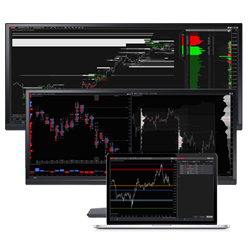
Rancho Dinero's full suite of Acme-brand volume, time, price and order flow analysis tools provide you everything you need to gain deep insight into your markets from multiple perspectives. Study your instruments. Strategize & define your risk. Stalk your trades and when opportunity knocks, strike!
A cutting-edge indicator designed to make order flow trading both effective and enjoyable. Featuring an intuitive footprint chart, it provides valuable insights into historical and real-time market activity. The footprint chart reveals buy and sell volumes and order flow within each price bar.
Weekly long form insights on the markets with weekly and twice daily algorithmic levels coupled with intraday NQ, ES and CL trading journal.
December 2, 2024
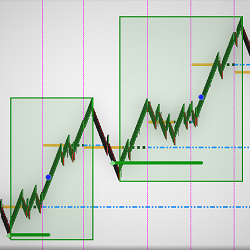
Mastering Sideways Markets With Auction Bars and Range Projections
November 19, 2024
Enhancing Your Automated Trading System: Key Insights from Best Pro Trade
November 14, 2024
NinjaTrader New Ecosystem Tools: October 2024 Edition
Enter Email for Updates

.png)