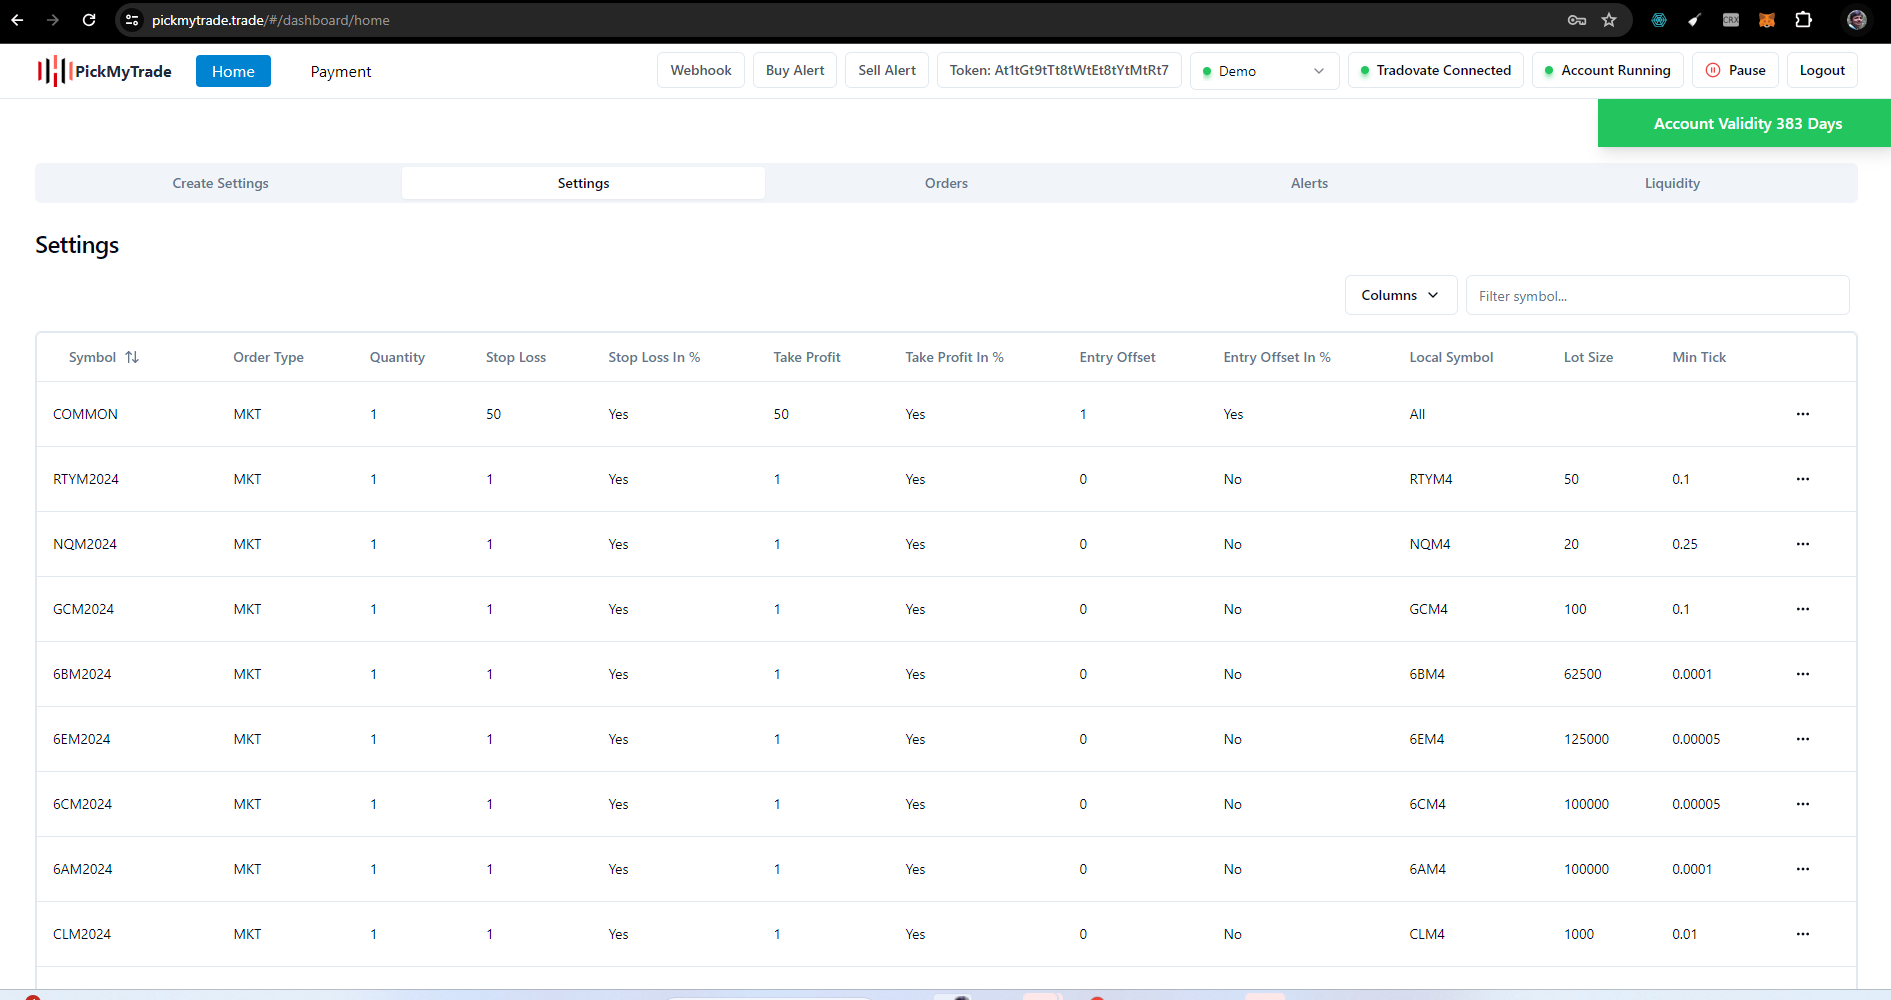
PickMyTrade specializes in automating trading bots, enabling seamless strategy execution for futures across well-known brokers such as Tradovate.
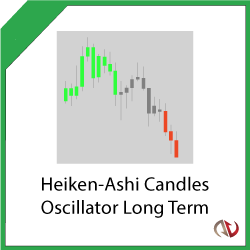
Eliminate noise with this indicator and identify long lasting and actionable trends with zero lag! It accurately visualizes trends and works on any chart type, detecting Bullish, Bearish and Neutral markets.
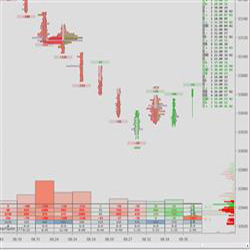
An easy-to-use order flow and volume profiling tool for NinjaTrader 8. The goal is to present order flow in a simple, clear way that also performs well in volatile markets. Numbers are not key here, visuals are. Algo helpers and trade execution assist included. Always evolving! Trial available.
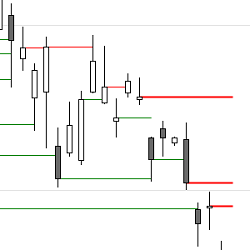
On instruments with regular trading hours you often see gaps on a chart which stay open for more than a day. A couple of times a month these open gaps from prior days also play an obvious role as support or resistance on the intraday chart. These tools are free to download and use!
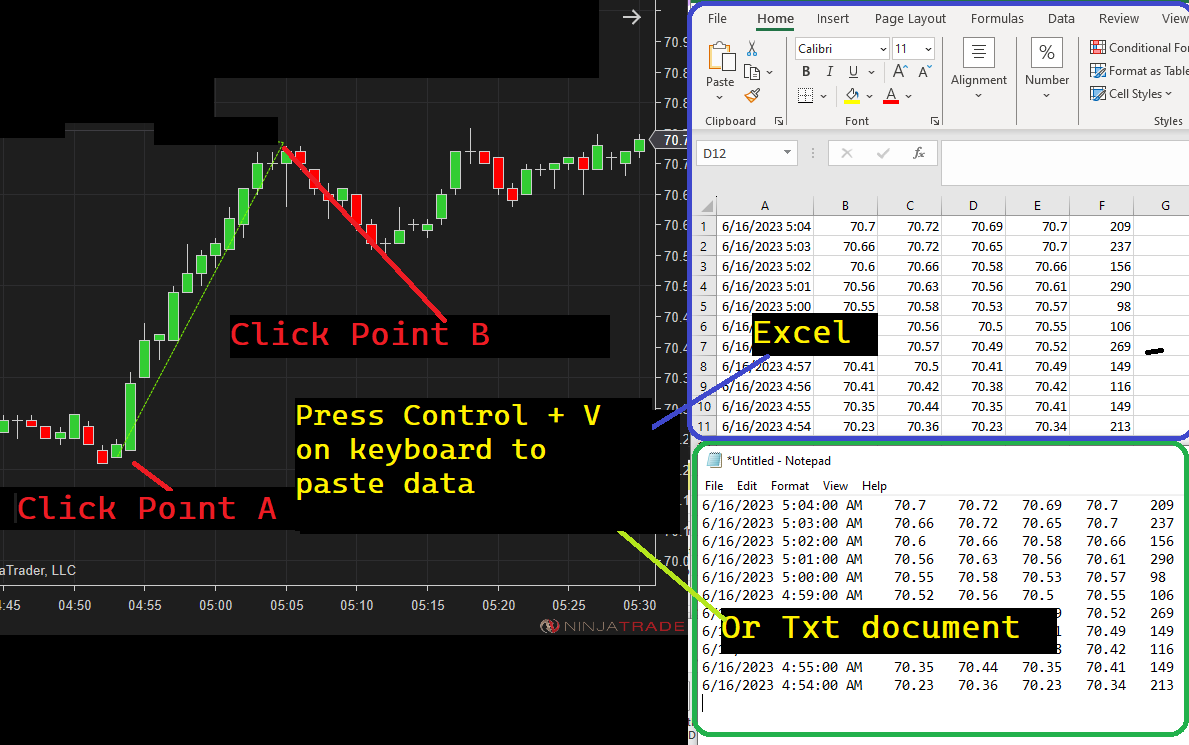
This innovative tool allows you to select any two points on your chart – effortlessly copying the corresponding bar values – and paste them directly into Excel or a text document using the familiar Ctrl+V shortcut.
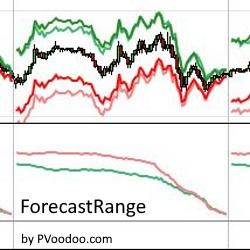
The PVForecastRange indicator calculates price moves and sets targets based on previous days’ statistical volatility. Try it for free!
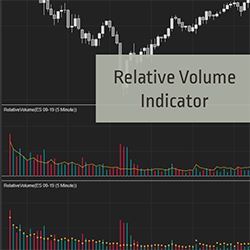
Detect unusual or below average volume easily. Identify the start or end of a move with no effort. Relative Volume (RVOL) compares current volume to the average volume for the same time of day. Start your 2-week trial now!
They provide educational videos on trading strategies and analysis for algorithmic trading markets. They offer insightful tips and techniques to help traders make informed decisions. Subscribe now to gain valuable trading knowledge and stay ahead of the competition.
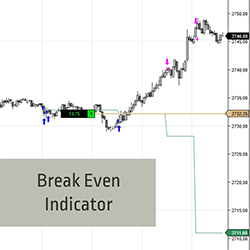
Want to hold on to trades longer? The Break Even indicator calculates profits taken into the average price of the remaining position. See the Break Even line move away from price & gain additional confidence to remain in your trade! It works for both long & short trades. Start your 2-week trial now!
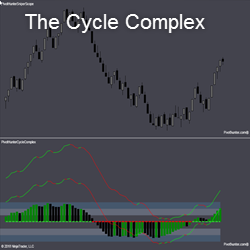
THE CYCLE COMPLEX measures price momentum at 4 levels: the histogram, 2 lines of higher sensitivity, and a dotted bull bear line. When the histogram is in the bands and turns, the pivot is often stronger. If the histogram is above or below the bands, the strength is even greater.
December 2, 2024
Mastering Sideways Markets With Auction Bars and Range Projections
November 19, 2024
Enhancing Your Automated Trading System: Key Insights from Best Pro Trade
November 14, 2024
NinjaTrader New Ecosystem Tools: October 2024 Edition
Enter Email for Updates