The Fibonacci Angle Fan forward plots equidistant Fibonacci trendlines from a single cast point.This provides leading edge Fibonacci Support & Resistance forecasting. Ideal for Price Action traders.Combine with traditional Fibonacci Technical Analysis methods & max tap the Fib Golden Ratio of 1.618%
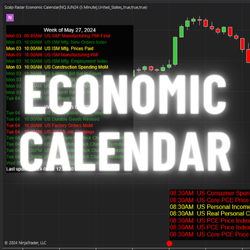
Stay ahead of market-moving events with this comprehensive news agenda, displaying upcoming events like CPI, PPI and Jobs data categorized by impact. Event marker are drawn directly on your chart with hover-over features. Filter by country, impact, or event name to optimize your trading strategy.
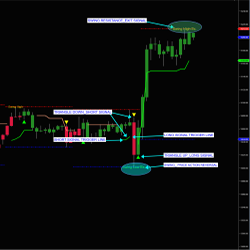
MagnaST122 and PAR Swing Indicator. Long: When price touches the moving average trigger line, a triangle up long signal triggers. Short: When price touches the moving average trigger line, a triangle down short signals. Swing low and swing high signal potential exit and/or price action reversal.
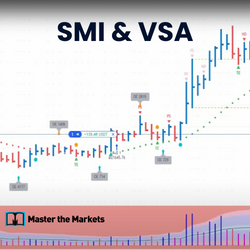
SMI was developed by the quants in the 1960's to help quantify tops and bottoms. It gives 3 strategy stats based on probabilities. However, a small limitation of the SMI is in selecting the T&Bs that are going to run. VSA helps you overcome that by looking at the volume for a big move.
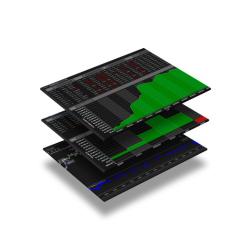
A category of automated tools designed for consistent rule-based trading management. Experience a structured approach to digital trading.
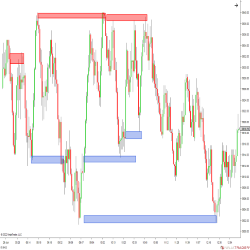
The V-Zones Trading Course is a fresh and unique approach to trading supply and demand and value. The dynamic approach to analysis gives you a trading map with precise trade locations and the skills to spot potential turning point locations in the markets.
The Tradesight Plus Mentorship is a six-month training program that teaches traders everything they need to know about stocks, futures, options, and Forex. It includes hours of recorded material, plus private mentoring sessions, trade blotter reviews weekly, and access to a live Trading Lab.
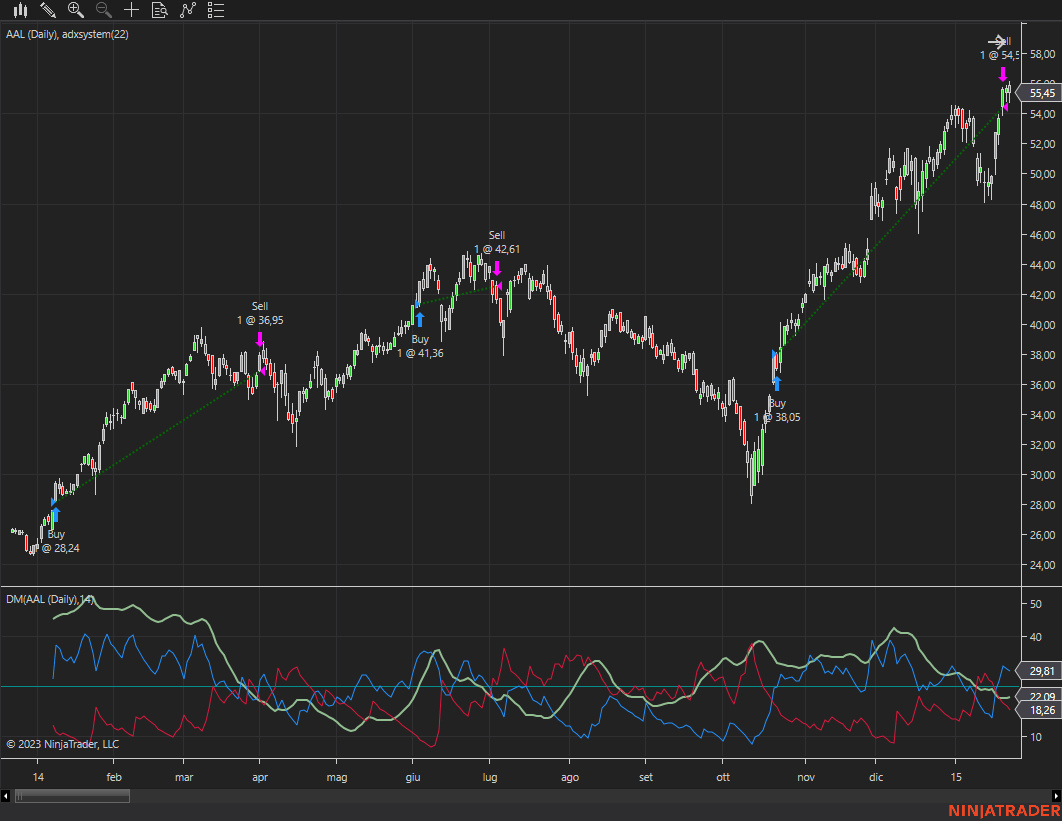
ADX trading system detecting price direction as well as trend strength.
If you're serious about learning to trade forex, this is the program for you. It includes all the knowledge and tools you need to succeed as a forex trader, and all taught in live markets with two seasoned traders. So grab your seat now, and start trading with confidence.
Get precious info to prepare for the trading session! Focused 100% in E-mini S&P500 Futures, Pre-Market Studies daily presents possible scenarios for the session, highlighting important regions based in a mix of technical analysis with order flow tools. Get started now with a FREE 15-day trial.
December 2, 2024
Mastering Sideways Markets With Auction Bars and Range Projections
November 19, 2024
Enhancing Your Automated Trading System: Key Insights from Best Pro Trade
November 14, 2024
NinjaTrader New Ecosystem Tools: October 2024 Edition
Enter Email for Updates