PriceIsKing.com's Stocks RAM Indicator is a powerful tool based on years of research and testing that shows equities traders entry points with arrows when the right condition is met. Get started with a free 2-week trial today!
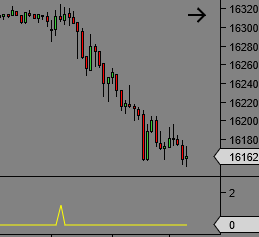
Unlock the power of divergence in demand index with this simple to use translation of the interpretations of 20 different variants all combined in one. Often finds the exact peak of the day or week or month in real time. Newly released to join the other version on here. Works in any time frame.
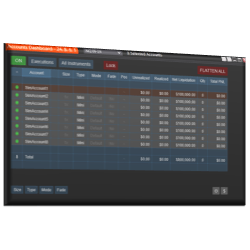
Duplicate Account Actions is the premiere NinjaTrader trade copier solution, built to keep all your positions and orders across all accounts in sync at all times. Finally, eliminate stress and challenges related to issues from other trade copier solutions!
This is a basic but powerful email training course aimed at newbies who want to get started in the world of trading and need a solid base of knowledge to help them survive the early stages of this business and increase their chances of success.
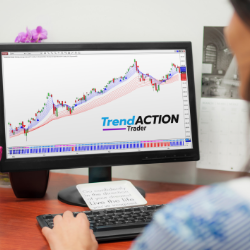
Trend Action Trader keeps you on the right side of the market with clear high probability signals for all markets and timeframes. Its price patterns and momentum algorithm are ideal whether you trade short or long term. Improve your trading consistency - try risk-free for 30-days!
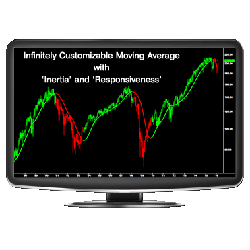
The ZMA™ is the most adaptable and customizable moving average indicator to date. By using an algorithm that incorporates the concepts of inertia, energy, and responsiveness, the ZMA is infinitely flexible and significantly more effective than other moving averages available.
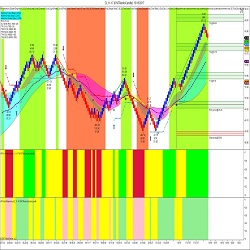
The HTS Master 2.0 is a trading solution that incorporates volatility and order flow to generate automated signals for scalping and trend following. The HTS commitment includes unlimited trading room access, private mentoring, & unlimited upgrades. Trade in Harmony now with a 2-week free trial.
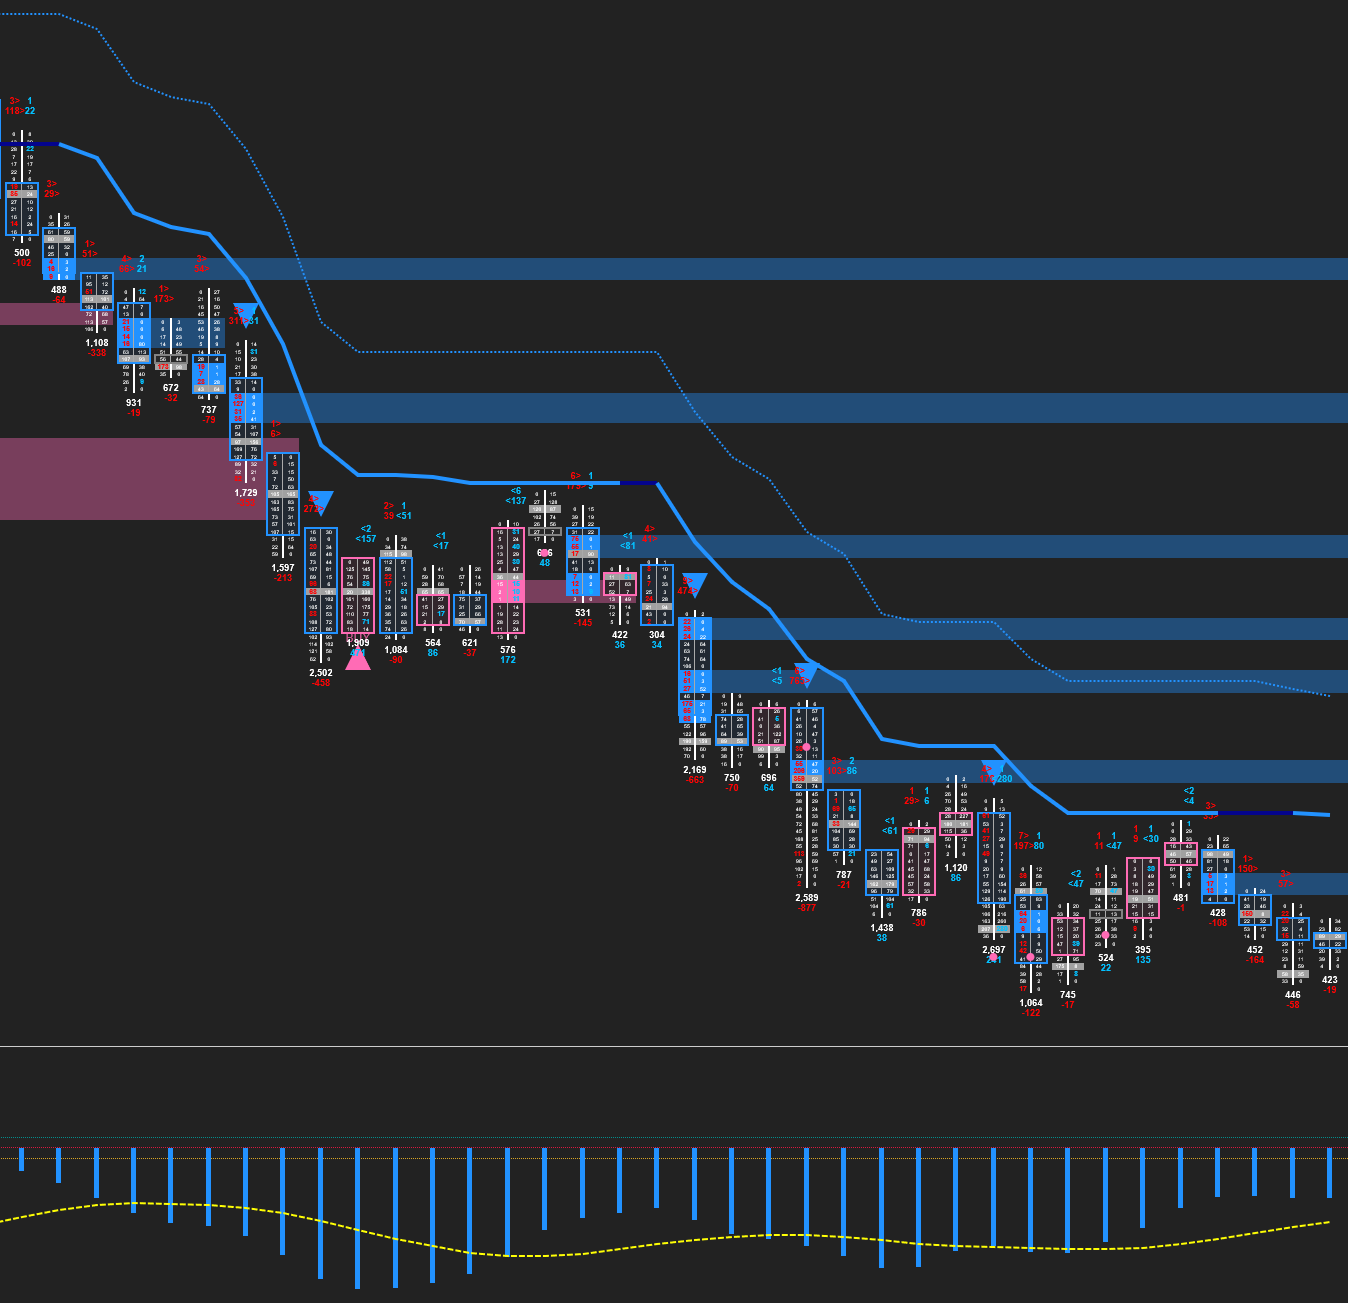
China Market Data, Order Flow
Daily Levels plots important levels such as prior days open/high/low/mid/close, overnight high/low/mid, IB high/low and more! It also displays historical probabilities of price touching each level in regular and overnight sessions for the most popular futures products.
The E-widget is a suite of tools like a Swiss Army knife, offering customizable analytical solutions for traders. Use E-mini Wizard preset templates for Fibonacci levels, support & resistance, risk:reward ideas, regression trades, or build your own. E-widget is designed to work on all markets.
December 2, 2024
Mastering Sideways Markets With Auction Bars and Range Projections
November 19, 2024
Enhancing Your Automated Trading System: Key Insights from Best Pro Trade
November 14, 2024
NinjaTrader New Ecosystem Tools: October 2024 Edition
Enter Email for Updates