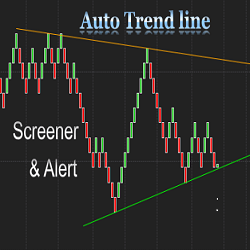
The Auto Trend Line Alert indicator will automatically plot the upper and lower trend lines based on the most recent swing points. It works on all timeframes. The NinjaTrader Market Analyzer makes it possible to track price action related to trend lines in any timeframe.
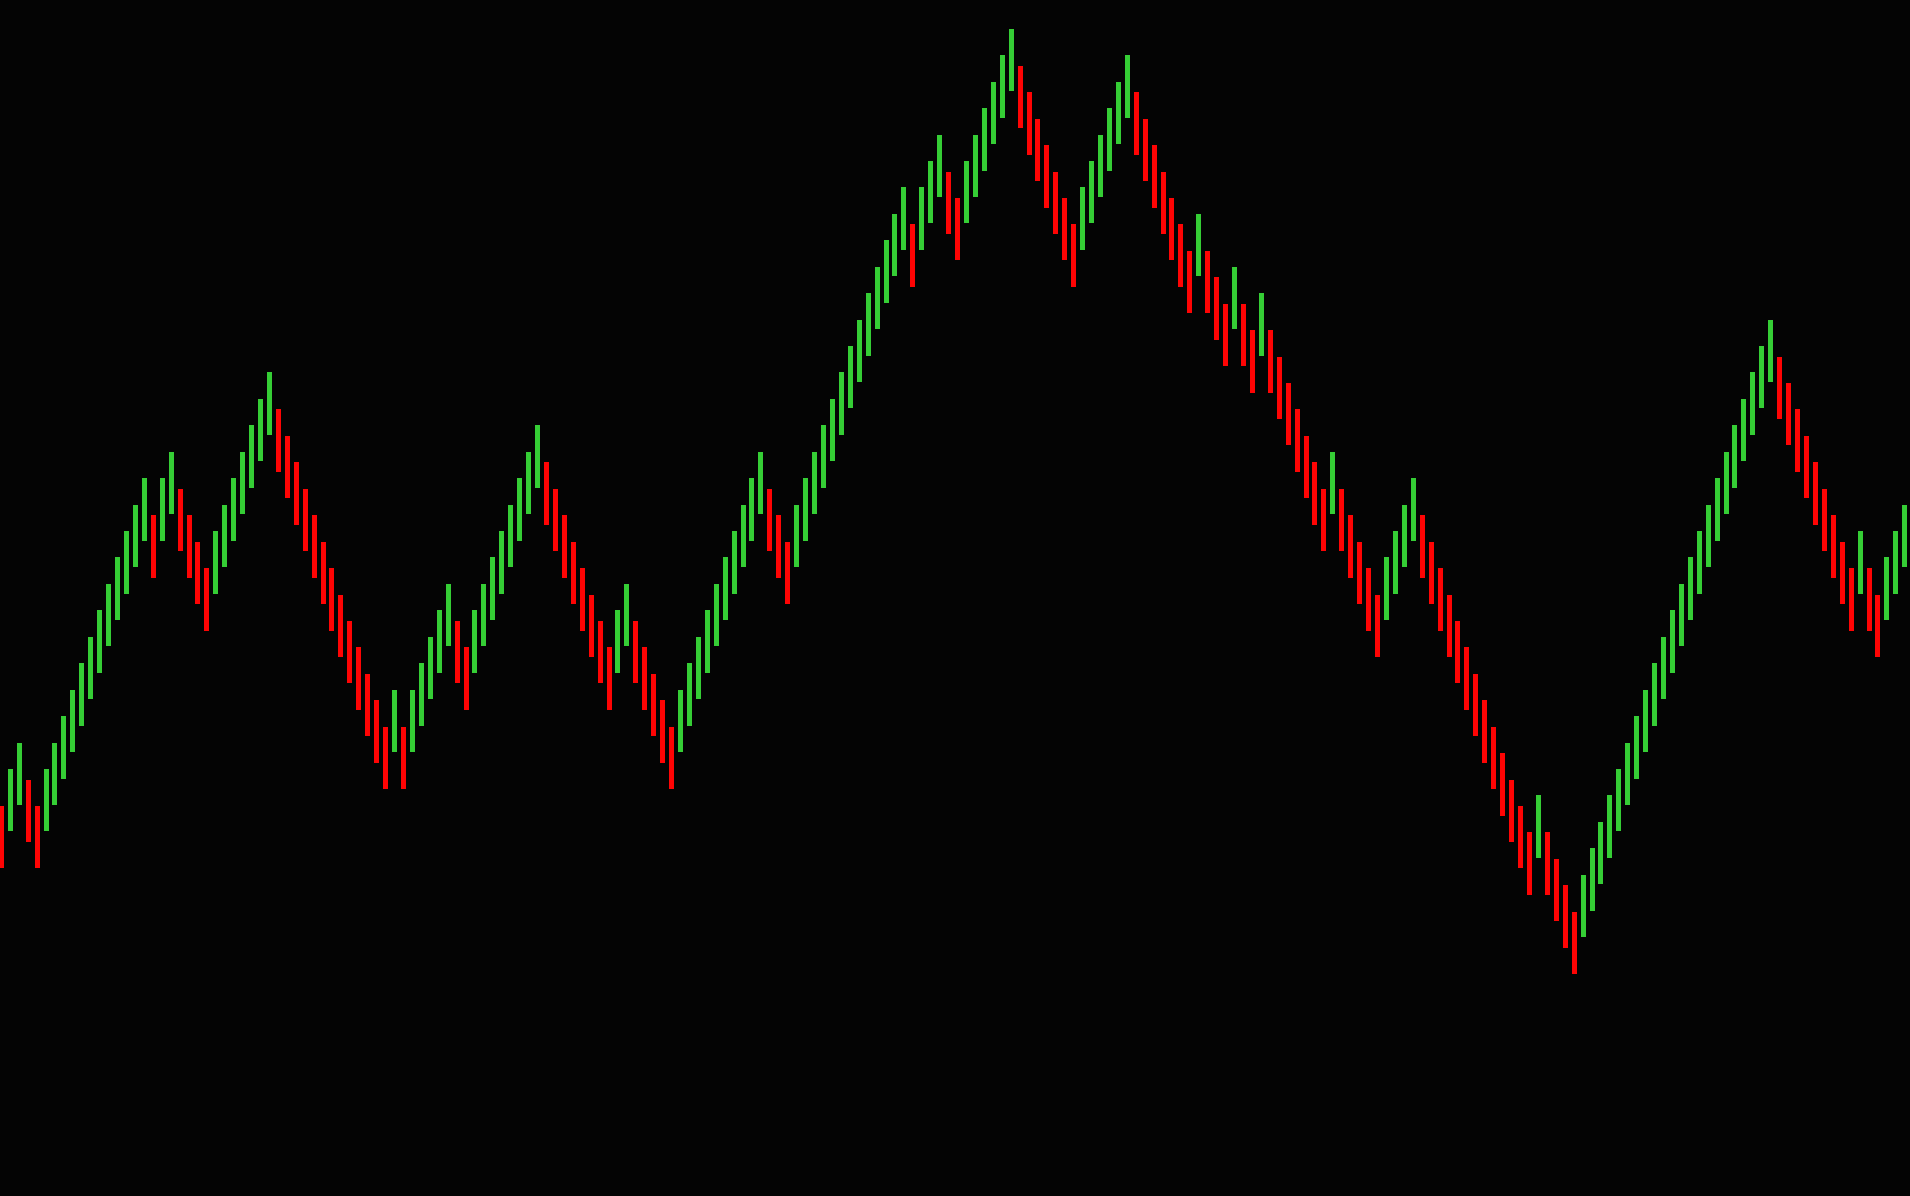
The "Qrenko" is their custom renko brick. This indicator helps traders see trending price action more clearly by smoothing out traditional candlesticks into "Qrenko" bricks. Traders can adjust the shift, offset, and range of the brick settings to suit their specific trading style.
Find out how you can identify accumulation and distribution with price action trading. Spot the footprints left by “smart money” with price and volume, the Wyckoff method way, when day trading or swing trading the stocks and futures. Join today and be part of the lifetime community group.
This is the ultimate mean Renko version (with wicks) for NinjaTrader 8. It removes noise and helps visualize trends. ninZaRenko can be used for charting, trading, backtesting, and programming. It is trusted and loved by thousands of traders worldwide. Download free now!
An automated strategy scalping method that searches for entry conditions at the extreme areas of the market. As price approaches the everchanging highs & lows during the trading session, the ABL will look for the various internal market requirements that it considers applicable for market entries.
A powerful self-study program that will help you learn the core principles and implementation of the Hunt Volatility Funnel Method with a total of 18 hours of material, topic by topic, alongside case studies and live trading webinars.
Join the Brooks Price Action Trading Room led by Al Brooks. Get daily live analysis, real-time trade setups, and interactive Q&A sessions. Enhance your trading skills with expert insights and strategies. Learn to read the market with precision.
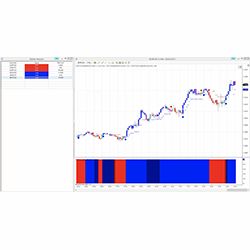
Our Day Trading software is based on price, support & resistance. It has undergone over 1000 hours of machine learning to build its algorithm. We send out algorithm updates regularly to keep the system performing. Built and tuned for day trading, it comes with a market analyzer radar screen.
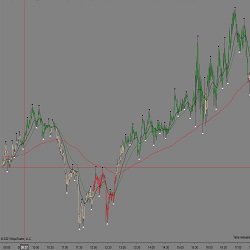
Trend Friend is a simple indicator designed to identify when the price in different time periods is aligned with select moving averages. It is not a closed methodology to operate but you can establish two systems to use this indicator: aggressive operation to paint signals or wait for a retracement.
This fully-automated trading strategy from Indicatortrader works on both NinjaTrader 7 & 8. It can operate 24 hours a day can be implemented in equity, futures and forex markets. Use this strategy to backtest years of historical data to find the best possible trading hours.
December 2, 2024
Mastering Sideways Markets With Auction Bars and Range Projections
November 19, 2024
Enhancing Your Automated Trading System: Key Insights from Best Pro Trade
November 14, 2024
NinjaTrader New Ecosystem Tools: October 2024 Edition
Enter Email for Updates