DTB Trading Lines - by Dynamic Trading Bars
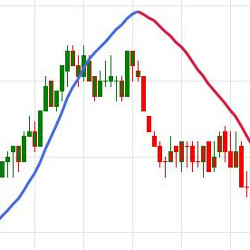
3 Secret Chart Settings to Skyrocket Your Results - by Day Trade Safe

TC_TrendingTSF - by TradingCoders
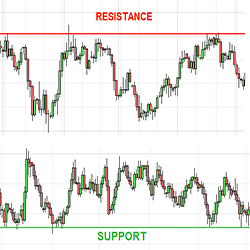
Support/Resistance Lines - by TREMPER.com
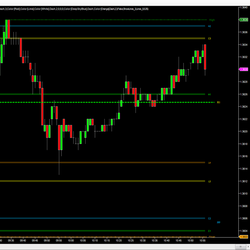
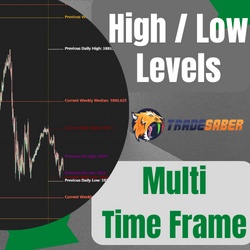
Multi Time Frame High/Low Levels - by TradeSaber
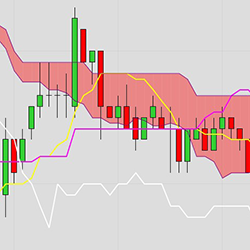
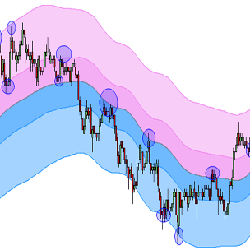
TC_NovelChannel - by TradingCoders

Free Indicator - by Mas Capital Global Ltd
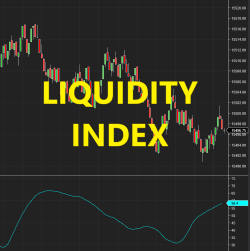
QWT Liquidity Index - by Quant-Wise