Divergence & Stochastics
September 22nd, 2020
Stochastics refers to a technical analysis tool which self-directed traders use to gauge momentum in a given market. In his webinar One Trade Business Plan, John of DayTradingRadio.com gives a detailed explanation of how Stochastics work and how to find trade opportunities by identifying their divergence with price action.
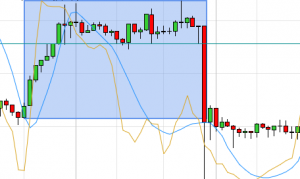
For example, when price makes a lower low but Stochastics plot a higher low, this is the divergence to look for. The plotting of Stochastics is known to be a proactive indicator vs a lagging, reactive indicator, helping to identify momentum shifts before they occur.
As John explains, “Here we have something where the indicator is going up when the price is going down, and that is key.”
Learn more in this 3-minute video:
Interested in tools related to Stochastics? Check out FREE technical analysis tools Pivot Zones and Wave Trend Oscillator.
Enter Email for Updates