Get precious info to prepare for the trading session! Focused 100% in E-mini S&P500 Futures, Pre-Market Studies daily presents possible scenarios for the session, highlighting important regions based in a mix of technical analysis with order flow tools. Get started now with a FREE 15-day trial.
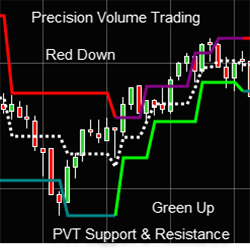
Precision Volume Trading Support & Resistance measures each swing point for traders to know where buyers and sellers are.
This self-paced course covers everything you need to know about using Visual Studio and NinjaTrader 8 together: installation, organizing code, source control, projects, assemblies, 3rd party code, NuGet packages, debugging and more. We offer a 30-day money back guarantee. Click to learn more!
Snow Eagle Trading uses a potent trio of filters: robust overbought/oversold zones, precise identification of reversal bars with real OHLC tracking, and enhanced signal reliability through RSI-based divergences. This comprehensive approach elevates your trading strategy.
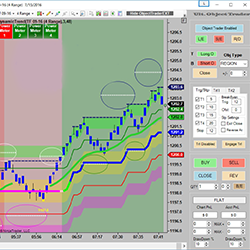
Object Trader is a comprehensive suite of trading tools aimed at simplifying the trading process. Traders choose from a variety of drawing tools, position the object in the desired location, adjust the trade parameters and Object Trader automates the trade management! Sign up for a free trial!
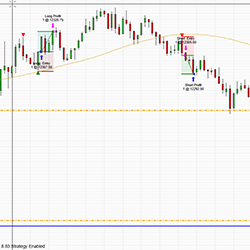
With a potential of 1 trade per day, this system is automated from start to finish & designed to be monitored in some capacity. If you can remotely access a computer with the right software, then you can monitor these automated trades from the golf course (with a strong cell signal).
The only things traders can truly control are stop management and position sizing. Risk Manager works with any system or collection of indicators. It also provides the means for you to launch ATM strategy templates for better money management. Maintain great trade management with every trade!
The Three Line Strike is a trend-continuation candlestick pattern consisting of four candles. Depending on their heights and collocation, a bullish or a bearish trend continuation can be predicted. The strategy can be combined with volume and price action to identify potential trades.
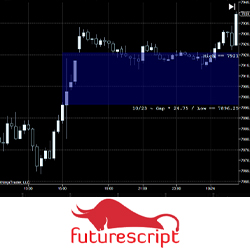
The Gap indicator was designed to illustrate when dramatic price disconnects from one period to the next when the market establishes critical levels. This indicator has been carefully constructed to explore different perspectives and trading approaches related to the gap in intuitive ways.
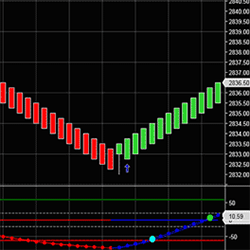
TrendLine Indicator plots red and blue lines to determine the trend. Easily detect the trend direction in any markets so you can easily find ideal trade setups. The red and blue arrows confirm the trend directions and plot above and below the candles.
March 25, 2024
Trading Pullbacks and Reversals: Simplifying a Once Complex Retail Trading Strategy
March 21, 2024
VWAP Indicator: Average Price Shown Based on Price, Volume
March 18, 2024
Trade Copier Strategies: Make Efficiency Work for You When Futures Trading
Enter Email for Updates