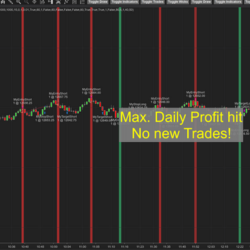
Auto trading strategy for NinjaTrader 8. Complete with up to 3 profit targets, trailing and breakeven stops, all customizable. Fully auto with customizable risk parameters such as max number of trades, max daily loss and max daily profit targets. Easy to use chart trader buttons for half auto/half.
The Fibonacci Angle Fan forward plots equidistant Fibonacci trendlines from a single cast point.This provides leading edge Fibonacci Support & Resistance forecasting. Ideal for Price Action traders.Combine with traditional Fibonacci Technical Analysis methods & max tap the Fib Golden Ratio of 1.618%
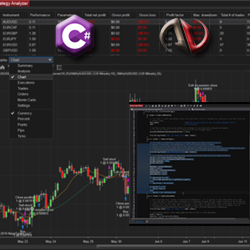
CandleRobot offers you custom programming services to transform your ideas into an algorithmic strategy that can boost your trading consistency. They use NinjaScript Editor for coding and NinjaTrader diversified tools to measure the strategy's profitability. Contact CandleRobot directly for a quote!
Are you tired of only being able to trade futures manually? We have a fully Otter-mated strategy, so you can make trades while you sleep or do the things you enjoy! Try it now with our special introductory period for your first three months.
Market Analyzer Column: Effortlessly tailor real-time market data to your needs.
The Tradesight Seeker and Comber tools for NinjaTrader use a specific bar counting approach to measure exhaustion points. The tools work on all charts and in the Market Analyzer in NinjaTrader.
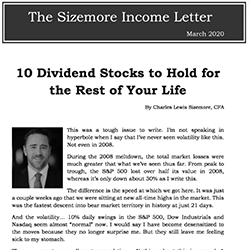
In the Sizemore Income Letter, Charles Sizemore recommends high-yielding investments designed to improve your consistency in the markets. Infused with a disciplined value approach, the Sizemore Income Letter looks for income investments that are a little off the beaten path.
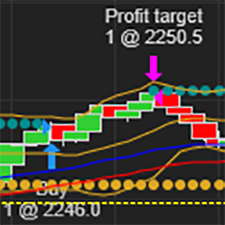
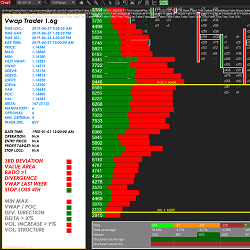
itcVwapTrader is a strategy for NinjaTrader 8 which is based on the mean reversion and the use of orderflow (vwap, footprint, market profile) for precise entries. This strategy uses more than 14 criteria for decision making. The strategy is highly customizable and comes in 3 versions.
The iCinDER™ MF (Market Forces) includes all of the iCinDER™ family of indicators as part of a complete set. The analysis is based on internal market force of the instrument being analyzed. Learn more!
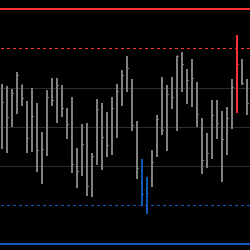
The Value Chart Indicator draws bars over a dynamically created scale from the last highest to the lowest values over a period. It attempts to spot market oversold and overbought areas on a short time scale, when price is most probable to revert to its mean.
March 25, 2024
Trading Pullbacks and Reversals: Simplifying a Once Complex Retail Trading Strategy
March 21, 2024
VWAP Indicator: Average Price Shown Based on Price, Volume
March 18, 2024
Trade Copier Strategies: Make Efficiency Work for You When Futures Trading
Enter Email for Updates